
Time-Resolved Solution Scattering
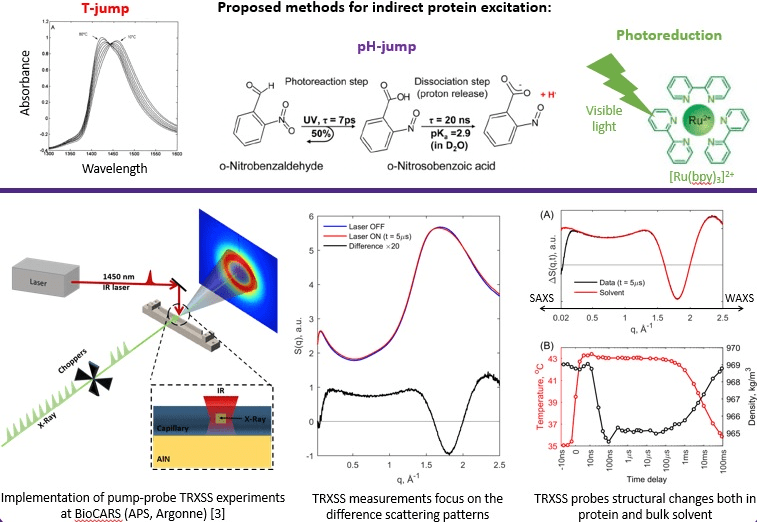
Time-resolved solution scattering is an important component of the overall efforts at BioCARS to address dynamic aspects of macromolecular function. One of the most significant advantages of X-ray solution scattering is the ability to study biological macromolecules under near-physiological conditions (pH or ionic strength, for example) in the absence of crystal packing constraints. Development of time-resolved X-ray solution scattering (TRXSS) at BioCARS has been driven by user interest and need. BioCARS staff, in collaboration with Philip Anfinrud (NIH/NIDDK), implemented the infrastructure for time-resolved solution scattering experiments at 14ID beamline. BioCARS TRXSS setup allows simultaneous collection of SAXS/WAXS difference signal.
The effort resulted in first solution scattering studies with 100ps time resolution (Cho et al., 2010; Kim J et al., 2011; Kim KH et al., 2011; Kim et al., 2012). These initial TRXSS experiments focused on myoglobin and dimeric hemoglobin molecules and were followed by studies of signaling pathways in photoactive yellow protein ( Cho at al., 2016) and bacteriophytochrome (Takkala et al., 2014, Björling et al., 2016). Most recent experiments utilized T-jumps induced by the infrared ns laser pulses and pH-jumps by using photo-caged protons. First T-jump TRXSS experiments studied details of insulin association and dissociation dynamics (Rimmerman et al., 2017, Rimmerman et al., 2018a). Using photo-acids for inducing pH–jump resulted in unprecedented nanosecond time-resolution in SAXS protein folding-unfolding dynamic studies (Rimmerman et al., 2018b), not available yet in rapid-mixing experiments.
Technical Capabilities
Time resolution
-
- 250ps resolution 48-bunch APS storage ring mode
- 100ns in standard APS mode
X-ray source
-
- two U21 in-line undulators, optimized for 12 keV,
- tunable: 9-15 keV, 12 keV standard
- polychromatic beam, 3-5% bandwidth
Q-range
-
- 0.015 to 4 Å-1 at 12 keV
- suitable for molecules ~150Å in size, radius of gyration up to 57 Å (globular proteins)
- camera lengths 180mm and 360mm
Sample delivery
-
- quartz capillary, 10-µm wall thickness (for reversible reactions)
- quartz capillary flow cell, 10-µm wall thickness, connected by FTE or PEEK tubing to a syringe (irreversible or slow reactions).
- capillary diameter: 300-700 µm
- thermal stabilization cell developed in collaboration with Lin Chen group ( Northwestern University) is available on request; temperature range: 10 -70°C
Lasers for reaction initiation:
-
- ps laser system: Spectra Physics, Ti:Sapphire Spitfire Pro 5; 780nm; 2ps; 1kHz; 5mJ/pulse; TOPAS OPA; tunable range: 350nm-2µm; pulses typically stretched to 30ps
- ns laser (UV/VIS): OPOTEK Opolette 355 HE; 7ns pulse duration; 20Hz; tunable range: 210-2200nm; max energy @ 300nm: 1mJ/pulse; max energy @ 450nm: 8mJ/pulse
- ns laser (NIR): OPOTEK Opolette 532 LD; 7ns pulse duration; 20Hz; tunable range: 650-2400nm; max energy @ 1400nm: 6mJ/pulse
- CW diode lasers at various wavelengths; ms exposures possible
Detector
-
- Rayonix MX340-HS (10-100 frames/sec)
Conducting Time-Resolved Experiments at BioCARS
TRXSS experiments are difference measurements. The reaction in the sample is initiated by short 30 ps or 7 ns laser pulse at suitable wavelength. After specified time-delay, an X-ray pulse of 250 ps to 3.6 µs duration is used as a probe. Sample is then refreshed by flowing or by translating the capillary to the adjacent fresh spot. The pump-probe process is repeated until desired signal-to-noise ratio is achieved and detector is read out. A no-laser or negative time delay (where X-ray pulse precedes the laser pulse) image is also collected. Such reference image is subtracted from the image at each (positive) time delay to obtain difference time-resolved signal. On average for irreversible reaction in 300 µm diameter capillary ~30 µL of sample solution is required to obtain one image with 100 ps time resolution and ~ 1µL to obtain an image with ~4 µs time resolution. Depending on the sample concentration and the amplitude of the time-resolved signal, tens to hundreds images are necessary to collect to obtain high signal-to-noise ratio required for good quality data, particularly in the WAXS q-range.
Experimental data are reduced to 1D SAXS curve by in-house software on-the-fly. The resulting difference data can also be analyzed by the singular value decomposition and can be fit globally to determine kinetic constants.
For examples of structural analysis of BioCARS TRXSS data and general information about SAXS technique please check here
General Information About SAXS Technique
-
- Blanchett and D.Svergun, Small Angle X-Ray Scattering on Biological Macromolecules and Nanocomposites in Solution. Ann. Rev. Phys. Chem. 64, 37-54 (2013)
- Putnam et al,.X-ray solution scattering (SAXS) combined with crystallography and computation: defining accurate macromolecular structures, conformations and assemblies in solution. Q. Rev. Biophys. 40,191–285 (2007)
- Koch,et al, Small-angle scattering: a view on the properties, structures and structural changes of biological macromolecules in solution. Q. Rev. Biophys. 36,147–227, (2003)
- Feigin, D. Svergun , Structure Analysis by Small-Angle X-Ray and Neutron Scattering. New York: Plenum . 1987
Solution Scattering Contacts
Irina Kosheleva
Research Beamline Scientist
(630) 252-0467
ikoshelev@cars.uchicago.edu


 Insulin hexamer dissociation dynamics revealed by photoinduced T-jumps and time-resolved X-ray solution scattering. a) Representative Kratky curves for bovine insulin under low pH conditions in aqueous-EtOH solution at 15, 30 and 50 °C representing the three major species. (b) SVD decomposition results from Kratky plot analysis.
D. Rimmerman, Photochemical & Photobiological Sciences, 7, 874-882, (2018)